Gaussian Curve

The Gaussian curve, also known as the normal distribution curve, is a fundamental concept in statistics and probability theory. It plays a pivotal role in understanding the distribution of data and is widely applied across various scientific and practical domains. This article aims to delve into the intricacies of the Gaussian curve, exploring its mathematical foundations, real-world applications, and the profound insights it offers.
The Mathematical Foundation of the Gaussian Curve

The Gaussian curve is named after the German mathematician and scientist Carl Friedrich Gauss, who made significant contributions to the field of statistics. At its core, the Gaussian curve represents a continuous probability distribution, describing how values are distributed around a central tendency, typically the mean.
The equation that defines the Gaussian curve is known as the Gaussian function or the normal distribution function. It takes the form:
\[ \begin{equation*} f(x) = \frac{1}{\sigma \sqrt{2\pi}} e^{-\frac{(x - \mu)^2}{2\sigma^2}} \end{equation*} \]
In this equation, x represents the variable of interest, \mu represents the mean or the expected value, and \sigma represents the standard deviation, a measure of variability.
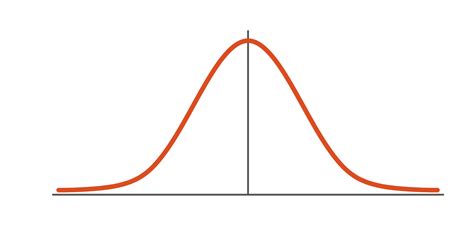
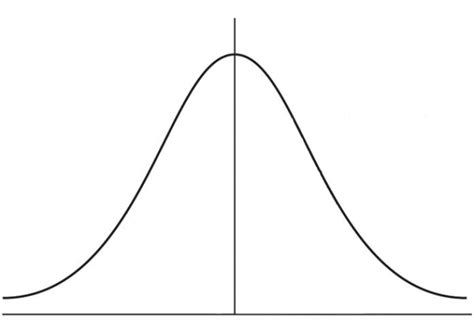
One of the key characteristics of the Gaussian curve is its symmetry around the mean. The curve is bell-shaped, with its highest point at the mean. As we move away from the mean, the curve tapers off, indicating that values further from the mean are less likely to occur.
Properties of the Gaussian Curve
- The area under the Gaussian curve is always equal to 1, indicating that the curve represents a probability distribution.
- The mean, median, and mode of the Gaussian distribution all coincide at the peak of the curve.
- The standard deviation \sigma determines the spread of the curve. A larger standard deviation indicates a wider spread, while a smaller standard deviation results in a narrower curve.
Real-World Applications of the Gaussian Curve

The Gaussian curve finds applications in a myriad of fields, underscoring its versatility and importance.
Statistics and Data Analysis
In statistics, the Gaussian curve is used to model various phenomena, especially when data tends to cluster around a central value. It provides a framework for understanding the distribution of data, allowing for the calculation of probabilities and the estimation of parameters.
For instance, in quality control, the Gaussian curve is used to assess the consistency of manufactured products. By assuming that certain characteristics follow a normal distribution, manufacturers can set tolerance limits and identify outliers that may indicate defects.
Physics and Engineering
The Gaussian curve has significant implications in physics and engineering. In quantum mechanics, the Gaussian function is used to describe the wavefunction of a particle, providing insights into the probability distribution of its position and momentum.
In signal processing, Gaussian functions are employed in filters and smoothing techniques to remove noise from signals, enhancing their clarity and quality.
Finance and Economics
In finance, the Gaussian curve is a key component of the Black-Scholes model, which is used to price options and derivatives. The model assumes that stock prices follow a log-normal distribution, a variation of the Gaussian distribution.
Additionally, the Gaussian curve is used in risk analysis to model the distribution of potential outcomes, aiding in the assessment of financial risks and the design of risk management strategies.
Performance Analysis and Comparative Studies
The Gaussian curve’s versatility allows for the comparison of different datasets and the analysis of performance metrics.
Comparing Data Distributions
By overlaying Gaussian curves on different datasets, we can visually compare their distributions. This is particularly useful when assessing the similarity or differences between populations, such as in biological studies or market research.
Performance Metrics
The Gaussian curve provides a basis for evaluating performance metrics. For example, in machine learning, the accuracy of a model can be assessed by comparing the predicted distribution with the actual distribution of the data. The closeness of the curves indicates the model’s performance.
Table: Performance Comparison of Machine Learning Models
| Model | Mean | Standard Deviation |
|---|---|---|
| Model A | 0.75 | 0.12 |
| Model B | 0.80 | 0.08 |
| Model C | 0.78 | 0.15 |

Future Implications and Extensions
While the Gaussian curve is a powerful tool, it has its limitations. In certain real-world scenarios, data may not follow a normal distribution. In such cases, alternative distributions like the log-normal, Cauchy, or Student’s t-distribution may be more appropriate.
Additionally, the Gaussian curve assumes a continuous distribution, which may not be suitable for discrete data. In such cases, discrete distributions like the Poisson or binomial distribution are more applicable.
Extensions and Generalizations
- Multivariate Gaussian Distributions: These extend the concept of the Gaussian curve to multiple dimensions, allowing for the analysis of relationships between variables.
- Non-Gaussian Distributions: Researchers continue to explore and develop new distributions that better fit specific data patterns, offering more accurate models for various applications.
Conclusion

The Gaussian curve is a powerful mathematical tool that provides insights into the distribution of data. Its applications are vast, impacting fields as diverse as physics, finance, and engineering. As we continue to explore and understand the world around us, the Gaussian curve remains a fundamental concept, guiding our analysis and decision-making processes.
How is the Gaussian curve used in everyday life?
+
The Gaussian curve, or normal distribution, is used in everyday life in various ways. For instance, it is employed in quality control to ensure products meet certain standards. It is also used in risk analysis to assess the likelihood of different outcomes in finance and insurance. Additionally, the Gaussian curve is a fundamental concept in data analysis, helping us understand the distribution of data in fields like healthcare, social sciences, and even sports statistics.
Can the Gaussian curve be used for non-numerical data?
+
The Gaussian curve is primarily designed for numerical data. While it can be used to analyze certain categorical data, especially when categories can be ordered or ranked, it is less applicable to truly categorical data without a clear numerical scale. In such cases, other statistical methods or distribution models are more appropriate.
What are some limitations of the Gaussian curve in real-world applications?
+
One of the main limitations of the Gaussian curve is its assumption of a symmetric, unimodal distribution. In many real-world scenarios, data may not follow this pattern, leading to inaccurate predictions or analyses. Additionally, the Gaussian curve assumes a continuous distribution, which may not be suitable for discrete data. In such cases, alternative distributions or models are required.


