Linear Function Meaning

The concept of a linear function is fundamental in mathematics and has wide-ranging applications across various fields. At its core, a linear function describes a straightforward relationship between two variables, where one variable changes at a constant rate as the other variable increases or decreases. This simplicity makes linear functions a powerful tool for modeling and analyzing real-world scenarios.
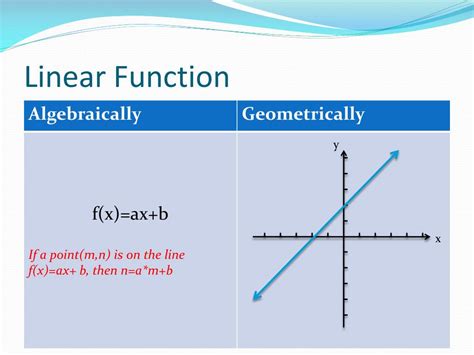
Linear functions are characterized by their graphical representation, which forms a straight line when plotted on a coordinate plane. This line, often referred to as the linear equation, can be defined by two key elements: the slope and the y-intercept. The slope determines the steepness of the line and the direction it slopes (upward or downward), while the y-intercept represents the point where the line crosses the y-axis.
Understanding Linear Functions

In mathematical terms, a linear function is an equation of the form y = mx + b, where m represents the slope of the line and b is the y-intercept. This equation encapsulates the relationship between x and y, two variables that can represent any number of real-world quantities.
For instance, consider a simple scenario where you're tracking the distance traveled by a vehicle over time. If the vehicle travels at a constant speed, the relationship between time and distance can be modeled using a linear function. In this case, x could represent time, and y could represent distance. The slope m would be the rate at which distance changes with time, effectively capturing the vehicle's speed.
The y-intercept b, on the other hand, could represent the starting point of the journey. If the vehicle starts from a stationary position, b would be zero, indicating that there's no distance traveled at time zero. However, if the vehicle starts from a specific location, b would represent that starting distance.
Slope and Its Significance
The slope of a linear function is a critical parameter that provides insight into the nature of the relationship between the two variables. A positive slope indicates that as one variable increases, the other variable also increases, but at a consistent rate. Conversely, a negative slope suggests that as one variable increases, the other variable decreases. The magnitude of the slope determines the steepness of the line, with larger values indicating a steeper incline or decline.
In our distance-time example, a positive slope would imply that the vehicle is moving forward, while a negative slope would suggest that it's moving backward. The steeper the slope, the faster the vehicle is moving, whether it's in the forward or backward direction.
Real-World Applications
Linear functions find applications in numerous fields, from physics and engineering to economics and social sciences. For instance, in physics, the relationship between force and acceleration in Newton's second law of motion can be modeled using a linear function. In economics, linear functions are used to model supply and demand curves, helping economists predict market behavior.
In the realm of technology, linear functions are integral to data analysis and machine learning. They're used to establish relationships between variables in datasets, making it possible to make predictions and draw insights from data. For instance, a linear function can be used to model the relationship between advertising spending and sales, allowing businesses to optimize their marketing strategies.
Analyzing Linear Functions

Analyzing linear functions involves examining their characteristics and understanding how they relate to the real-world scenario they model. This analysis often includes determining the slope and y-intercept, as well as plotting the line on a graph to visualize the relationship between the variables.
Slope Calculation
Calculating the slope of a linear function is a straightforward process. Given two points on the line, (x1, y1) and (x2, y2), the slope m can be calculated using the formula:
| Slope (m) | = (y2 - y1) / (x2 - x1) |
|---|

This formula essentially calculates the change in y divided by the change in x, providing a measure of how much y changes for each unit change in x.
Finding the Y-Intercept
The y-intercept of a linear function can be determined by substituting x as zero in the equation y = mx + b. This gives us y = b, allowing us to find the point where the line crosses the y-axis.
Visualizing Linear Functions
Graphing linear functions provides a visual representation of the relationship between the variables. By plotting the points and connecting them with a straight line, we can see how the variables change in relation to each other. This visualization is particularly useful for understanding trends and making predictions.
Transforming Linear Functions
Linear functions can be transformed through various operations, such as reflection, dilation, and translation, without changing their essential linear nature. These transformations can modify the appearance of the line on a graph but don't alter the underlying relationship between the variables.
Reflection
Reflecting a linear function across the x-axis or y-axis changes the sign of the slope, effectively reversing the direction of the line. For instance, if the original function has a positive slope, reflecting it across the x-axis would result in a function with a negative slope, and vice versa.
Dilation
Dilating a linear function involves changing the scale of the line without altering its direction. This can be achieved by multiplying the slope by a constant factor. For example, dilating a function with a slope of 2 by a factor of 3 would result in a new function with a slope of 6, making the line steeper.
Translation
Translating a linear function means shifting its position on the coordinate plane without changing its slope or y-intercept. This is achieved by adding or subtracting a constant to either the x or y coordinates. For instance, translating a function by 3 units to the right would involve adding 3 to all x-values in the equation.
Conclusion and Future Implications
Linear functions are a cornerstone of mathematical analysis, offering a simple yet powerful way to model and understand relationships between variables. Their versatility and applicability across diverse fields make them an essential tool for researchers, scientists, and professionals in various industries.
As technology and data-driven decision-making continue to evolve, the understanding and application of linear functions will remain crucial. The ability to model, analyze, and transform linear relationships will continue to play a pivotal role in advancing scientific understanding and solving real-world problems.
What is the y-intercept in a linear function?
+The y-intercept in a linear function represents the point where the line crosses the y-axis. It is denoted by the value b in the equation y = mx + b and provides insight into the starting point or initial value of the variable y.
How do you determine the slope of a linear function from a graph?
+To determine the slope of a linear function from a graph, choose two points on the line and calculate the change in y divided by the change in x (rise over run). This value represents the slope and indicates the rate at which y changes for each unit change in x.
What are some real-world scenarios where linear functions are applicable?
+Linear functions are applicable in various real-world scenarios, such as modeling the relationship between distance and time for moving objects, analyzing the correlation between advertising spending and sales in marketing, and predicting the relationship between supply and demand in economics.


