Statistically Significant

Welcome to a comprehensive exploration of the concept of statistical significance, a cornerstone in the world of data analysis and research. This article will delve into the intricacies of this fundamental statistical principle, providing a detailed understanding of its importance, calculation methods, real-world applications, and the profound impact it has on our interpretation of data. As we navigate through this guide, we'll uncover the fascinating ways in which statistical significance shapes our understanding of the world around us, from scientific discoveries to business strategies.
Understanding Statistical Significance

Statistical significance is a vital concept in data analysis, serving as a critical tool for researchers, analysts, and scientists to make informed decisions and draw reliable conclusions from data. At its core, statistical significance provides a measure of confidence that an observed effect or result is not simply due to chance but is, in fact, a real and meaningful phenomenon.
In the realm of statistics, an event is considered statistically significant when its occurrence is unlikely to be observed by chance alone. This determination is made by comparing the probability of the observed result to a predefined significance level, often denoted as α (alpha). The significance level represents the threshold probability at which we decide to reject the null hypothesis, which typically assumes no relationship or no effect.
For instance, imagine a pharmaceutical company testing a new drug. The company wants to ensure that any observed improvements in patient health are due to the drug's effectiveness and not just random chance. By setting a significance level of 0.05 (5%), the company essentially states that they are willing to accept a 5% risk of declaring the drug effective when it is not (a Type I error). If the results of the drug trial show a statistically significant improvement in patient health, the company can be confident that the drug truly works.
The Calculation of Statistical Significance

The calculation of statistical significance involves a series of steps, each crucial in determining the reliability of an observed effect. These steps typically include:
Hypothesis Formulation
The process begins with the formulation of two hypotheses: the null hypothesis (H0) and the alternative hypothesis (Ha or H1). The null hypothesis assumes no effect or relationship, while the alternative hypothesis suggests the presence of an effect or relationship.
Data Collection and Analysis
Researchers then collect and analyze data relevant to the hypotheses. This data can come from various sources, including experiments, surveys, or observational studies.
Test Statistic Calculation
Next, a test statistic is calculated. This value is a measure of how much the observed data deviate from what would be expected under the null hypothesis. Common test statistics include the z-score, t-statistic, and F-statistic, each appropriate for different types of data and hypotheses.
P-value Determination
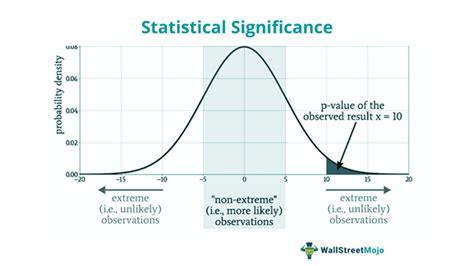
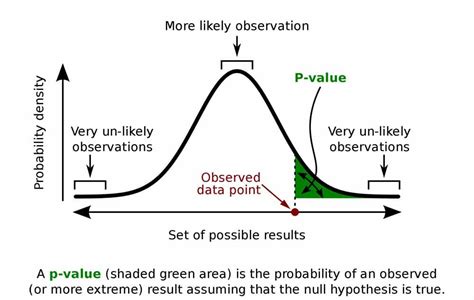
The p-value, or probability value, is then calculated. The p-value represents the probability of obtaining a test statistic at least as extreme as the one calculated, assuming the null hypothesis is true. A smaller p-value indicates a result less likely to be observed by chance, thus increasing the evidence against the null hypothesis.
Decision Making
The p-value is compared to the predefined significance level, α. If the p-value is less than α, the null hypothesis is rejected in favor of the alternative hypothesis. This indicates that the observed effect is statistically significant and unlikely to be due to chance.
Applications of Statistical Significance
Statistical significance is a versatile concept with applications across numerous fields and industries. Here are some key areas where it plays a pivotal role:
Scientific Research
In scientific research, statistical significance is crucial for establishing the validity of experimental results. Whether in medicine, physics, or psychology, researchers rely on statistical significance to determine if their findings are meaningful and can be generalized beyond the specific study.
Medical Trials
Medical researchers use statistical significance to assess the effectiveness of new treatments, medications, or therapies. By comparing the outcomes of a treatment group to a control group, researchers can determine if the treatment has a significant impact on patient health.
Marketing and Business
Businesses leverage statistical significance to make data-driven decisions. For instance, marketers may use A/B testing to compare the effectiveness of different advertising campaigns, with statistical significance determining which campaign is more likely to succeed.
Quality Control
In manufacturing and quality control, statistical significance helps identify significant deviations from standards or specifications. This allows companies to take corrective actions to maintain product quality.
Social Sciences
Social scientists use statistical significance to analyze survey data, study trends, and draw conclusions about human behavior, attitudes, and beliefs.
| Field | Example Application |
|---|---|
| Medicine | Determining the effectiveness of a new cancer treatment |
| Economics | Analyzing the impact of a policy change on the economy |
| Psychology | Studying the effectiveness of a new therapy for depression |
| Environmental Science | Assessing the impact of climate change on biodiversity |
| Marketing | Comparing the success of different advertising strategies |

Misconceptions and Challenges
Despite its importance, statistical significance is not without its challenges and potential pitfalls. Some common misconceptions include:
Statistical Significance and Practical Significance
Statistical significance does not necessarily equate to practical significance. A result may be statistically significant but have little practical impact or vice versa. It is essential to consider the magnitude of the effect and its potential implications.
Sample Size and Power
The size of the sample used in a study can impact the statistical power, which is the ability of a study to detect a true effect. A study with low power may fail to detect a significant effect, even if it exists.
Multiple Testing
When multiple statistical tests are performed on the same dataset, the probability of obtaining at least one statistically significant result by chance increases. This is known as the multiple testing problem, which can lead to false positives.
Publication Bias
Publication bias refers to the tendency for studies with statistically significant results to be more likely to be published, while non-significant results may remain unpublished. This can distort the overall body of evidence and lead to an overestimation of effect sizes.
Conclusion

Statistical significance is a cornerstone of data analysis, providing a robust framework for researchers and analysts to interpret and make sense of data. By understanding the principles and applications of statistical significance, we can better appreciate the reliability and validity of various research findings, business strategies, and scientific discoveries. While challenges and misconceptions exist, a solid grasp of statistical significance empowers us to navigate these complexities and make more informed decisions in a data-driven world.
What is the difference between statistical significance and practical significance?
+Statistical significance refers to the likelihood that an observed effect is not due to chance. Practical significance, on the other hand, considers the magnitude and real-world impact of the effect. A result may be statistically significant but have little practical value, or it may be practically significant but statistically insignificant.
How does the choice of significance level affect the results?
+The significance level, often denoted as α, determines the threshold for rejecting the null hypothesis. A lower significance level (e.g., 0.01) makes it harder to reject the null hypothesis, increasing the confidence in the result but also increasing the risk of a Type II error (failing to reject a false null hypothesis). Conversely, a higher significance level (e.g., 0.10) makes it easier to reject the null hypothesis but may increase the risk of a Type I error (rejecting a true null hypothesis).
What are some common tests used to determine statistical significance?
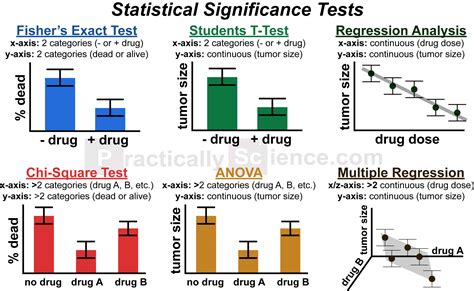
+Common tests include the z-test, t-test, chi-square test, and analysis of variance (ANOVA). The choice of test depends on the type of data and the research question. For example, a t-test is often used for comparing means between two groups, while ANOVA is used for comparing means across multiple groups.


