What Is Linear Function
Welcome to an in-depth exploration of the linear function, a fundamental concept in mathematics with a wide range of applications in various fields. This article aims to provide a comprehensive understanding of linear functions, their properties, and their significance in different contexts.
Linear functions are a cornerstone of algebra and mathematics, offering a simple yet powerful way to model and understand various phenomena in the real world. From describing the relationship between two variables to solving complex equations, linear functions provide a versatile toolset for mathematicians, scientists, engineers, and many other professionals.
Understanding Linear Functions
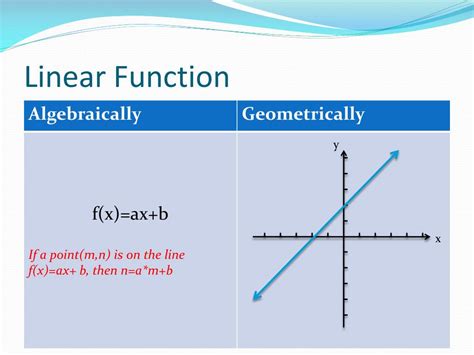
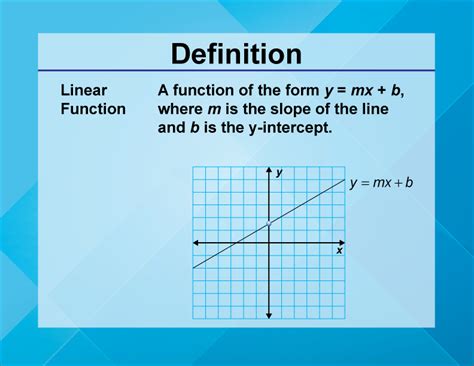
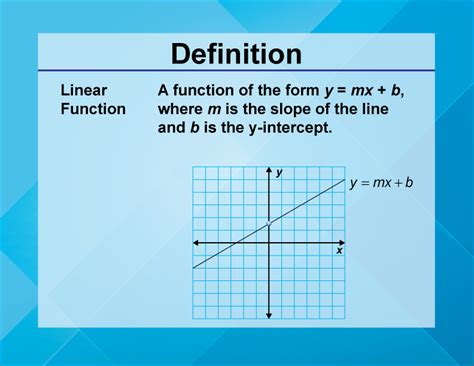
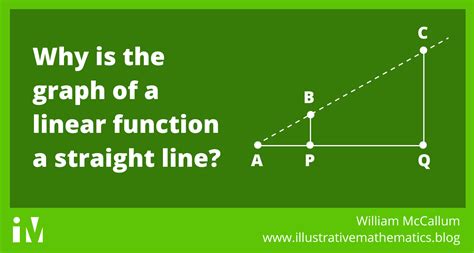
At its core, a linear function represents a straight line in the coordinate plane. This line is defined by its slope and y-intercept, which together determine the function’s behavior and characteristics. The linear function equation can be written as y = mx + b, where m represents the slope and b is the y-intercept.
The slope, often denoted as m, is a measure of the steepness of the line. It represents the rate of change of the dependent variable y with respect to the independent variable x. A positive slope indicates that the line rises as we move from left to right, while a negative slope suggests a downward trend. A slope of zero represents a horizontal line.
The y-intercept, denoted as b, is the point where the line intersects the y-axis. It gives us the value of y when x is zero. In practical terms, the y-intercept can be thought of as the initial value or starting point of the function.
Key Properties of Linear Functions
- Constant Rate of Change: Linear functions exhibit a constant rate of change, meaning that the slope remains the same throughout the function. This property ensures that the line is straight and does not curve or bend.
- Unique Solution: For any given pair of coordinates (x, y), there is exactly one linear function that passes through that point. This uniqueness is a fundamental property that makes linear functions useful for modeling and prediction.
- Additivity: Linear functions are additive, meaning that the sum of two linear functions is also a linear function. This property simplifies many mathematical operations and allows for efficient computations.
- Simplicity: The simplicity of linear functions makes them an ideal starting point for understanding more complex mathematical concepts. Many real-world relationships can be approximated using linear functions, even if they are not perfectly linear.
Applications of Linear Functions
Linear functions find applications in a myriad of fields, including but not limited to physics, economics, computer science, and engineering. Some notable applications include:
1. Economics and Finance
Linear functions are used to model various economic phenomena, such as supply and demand curves, cost-benefit analyses, and price elasticity. They help economists and financial analysts make predictions and optimize strategies.
2. Physics and Engineering
In physics, linear functions describe constant acceleration, uniform motion, and many other physical phenomena. Engineers rely on linear functions for designing structures, optimizing processes, and analyzing systems.
3. Computer Graphics and Machine Learning
Linear algebra, which is closely related to linear functions, is a fundamental tool in computer graphics and machine learning. It enables the manipulation and transformation of data, facilitating tasks like image processing, data visualization, and artificial intelligence.
4. Social Sciences and Psychology
Linear functions are employed in the social sciences to study trends, correlations, and relationships between variables. For example, they can be used to model the relationship between education level and income or to analyze the impact of advertising on consumer behavior.
Visualizing Linear Functions
Visual representations are a powerful tool for understanding linear functions. By plotting the function on a coordinate plane, we can gain insights into its behavior and characteristics. Here’s an example of a linear function plotted on a graph:
| X | Y |
|---|---|
| 0 | 3 |
| 1 | 5 |
| 2 | 7 |
| 3 | 9 |
In this example, the linear function has a slope of 2 (the rate of change) and a y-intercept of 3. The table shows the values of y for different values of x, and the graph visually represents the line defined by the function.
Solving Linear Equations
Solving linear equations is a fundamental skill in mathematics. Linear equations are equations that can be written in the form ax + b = c, where a, b, and c are constants, and x is the variable we want to solve for. There are several methods to solve linear equations, including:
- Isolating the Variable: This method involves rearranging the equation to isolate the variable x on one side of the equation. By performing inverse operations, we can solve for x directly.
- Substitution: Substitution is a powerful technique for solving linear equations with multiple variables. It involves solving for one variable in terms of the others and then substituting that expression into the original equation to solve for the remaining variable.
- Elimination: The elimination method is particularly useful for systems of linear equations. It involves manipulating the equations to eliminate one variable, allowing us to solve for the remaining variable.
Let's illustrate these methods with an example:
Example: Solve the equation 2x + 3 = 7.
Solution:
- Isolating the Variable:
- Subtract 3 from both sides: 2x + 3 - 3 = 7 - 3 becomes 2x = 4.
- Divide by 2: 2x / 2 = 4 / 2 gives us x = 2.
- Substitution:
- Rearrange the equation to solve for x: x = (7 - 3) / 2.
- Substitute this expression into the original equation: 2((7 - 3) / 2) + 3 = 7.
- Simplify and verify that the equation holds true.
- Elimination:
- Since this is a single equation, the elimination method is not necessary.
All three methods lead to the same solution, x = 2, demonstrating the versatility of linear equation solving techniques.
Real-World Examples
Linear functions are everywhere in our daily lives, often describing relationships between variables in practical situations. Here are a few real-world examples:
1. Distance and Time
When traveling at a constant speed, the distance covered is directly proportional to the time taken. This relationship can be modeled using a linear function. For instance, if a car travels at a constant speed of 60 km/h, the distance covered after x hours can be calculated as 60x kilometers.
2. Sales and Revenue
In business, the relationship between the number of items sold and the total revenue generated is often linear. If a company sells t-shirts at a fixed price of \10$ each, the revenue R generated from selling x t-shirts can be calculated as R = 10x.
3. Population Growth
Population growth in certain scenarios can be approximated using linear functions. For example, if a city’s population is growing at a constant rate of 2,000 people per year, the population P after x years can be estimated as P = 2,000x.
Conclusion and Future Directions
Linear functions are an essential foundation for understanding more complex mathematical concepts and real-world phenomena. Their simplicity, uniqueness, and versatility make them a powerful tool in various fields. As we delve deeper into mathematics and its applications, linear functions continue to serve as a cornerstone for more advanced topics.
In the future, the study of linear functions will remain integral to mathematics education, providing a solid foundation for students to explore more intricate mathematical ideas. Additionally, the applications of linear functions will continue to expand as new technologies and scientific discoveries emerge, offering fresh perspectives and challenges for mathematicians and scientists alike.
How do I graph a linear function?
+To graph a linear function, you need to identify its slope and y-intercept. Once you have these values, you can plot the y-intercept on the coordinate plane and then use the slope to determine the direction and steepness of the line. For example, if the slope is 2 and the y-intercept is (0, 3), you would start at (0, 3) and move up 2 units and right 1 unit to find the next point. Continue this process to plot the entire line.
What are some common mistakes to avoid when working with linear functions?
+Some common mistakes include confusing the slope and y-intercept, misinterpreting the meaning of the slope (whether it represents a positive or negative rate of change), and neglecting to check if a given point satisfies a linear equation. It’s also important to ensure that your calculations are accurate when solving linear equations, as small errors can lead to incorrect results.
Can linear functions be used to model non-linear relationships?
+While linear functions are best suited for modeling linear relationships, they can also be used as approximations for non-linear relationships in certain situations. For example, when data exhibits a general trend but has some fluctuations, a linear function can provide a reasonable approximation. However, it’s important to be cautious and ensure that the linear model is a good fit for the data before making any conclusions.


